"""
Generate Plot
"""
PATH = f"{config.MINTING_FOLDER}/{COLLECTION}_minting.csv"
minting = pd.read_csv(PATH)
grifter_minting = minting[minting["to_account"] == grifter_address]
grifter_mint_count = len(grifter_minting)
minted_as_much = minting.groupby("to_account").filter(
lambda x: x["to_account"].count() >= grifter_mint_count
) # try to find non-grifter with similiar mint count (greater or equal)
minted_as_much = minted_as_much[
minted_as_much["to_account"] != grifter_address
] # exclude grifter
closest_list = minted_as_much["to_account"].value_counts(ascending=True).index.tolist()
non_grifter_address = closest_list[
6
] # arbitrarily picked 7th closest mint count bc it is the first with uniform-ish distribution
non_grifter_minting = minting[minting["to_account"] == non_grifter_address]
print("Grifter sample size: ", grifter_mint_count)
print("Non grifter sample size: ", len(non_grifter_minting))
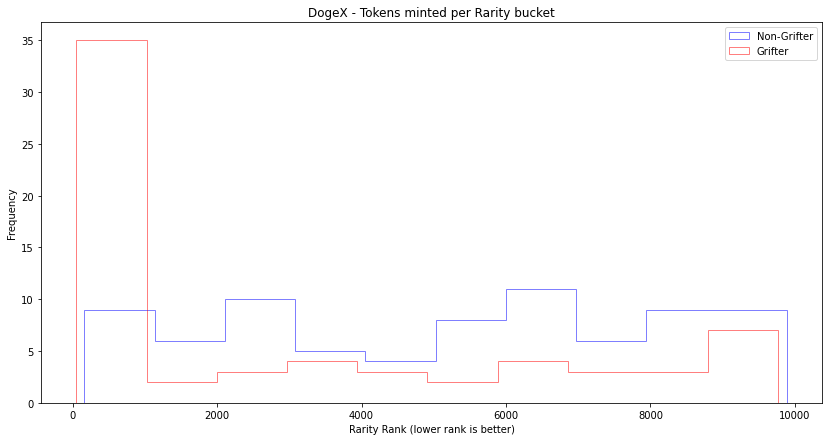
plt.figure(figsize=(14, 7))
plt.hist(
non_grifter_minting["rank"],
bins=10,
alpha=0.5,
color="b",
label="Non-Grifter",
histtype="step",
)
plt.hist(
grifter_minting["rank"],
bins=10,
alpha=0.5,
color="r",
label="Grifter",
histtype="step",
)
plt.legend(loc="upper right")
plt.xlabel("Rarity Rank (lower rank is better)")
plt.ylabel("Frequency")
plt.title("{} - Tokens minted per Rarity bucket".format(COLLECTION))
plt.show()