"""
@author: mdigi14
"""
import pandas as pd
import matplotlib.pyplot as plt
import math
from honestnft_utils import config
"""
Plot params
"""
plt.rcParams.update({"figure.facecolor": "white", "savefig.facecolor": "white"})
"""
Helper Functions
"""
def print_graph(RARITY_DB: pd.DataFrame, zoom_in: bool = False) -> None:
if zoom_in:
y_lim = Y_LIM
lower_bound = LOWER_BOUND
upper_bound = UPPER_BOUND
top_n = TOP_N
else:
# Count number of tokens in Rarity DB and round up to nearest 100
TOKEN_COUNT = int(math.ceil(max(RARITY_DB[TOKEN_COL] / 100.0)) * 100)
y_lim = upper_bound = top_n = TOKEN_COUNT
lower_bound = 0
if TOKEN_COL == "TOKEN_NAME":
RARITY_DB["TOKEN_ID"] = (
RARITY_DB["TOKEN_NAME"].str.split("#").str[1].astype(int)
)
RARITY_DB = RARITY_DB.sort_values("TOKEN_ID")
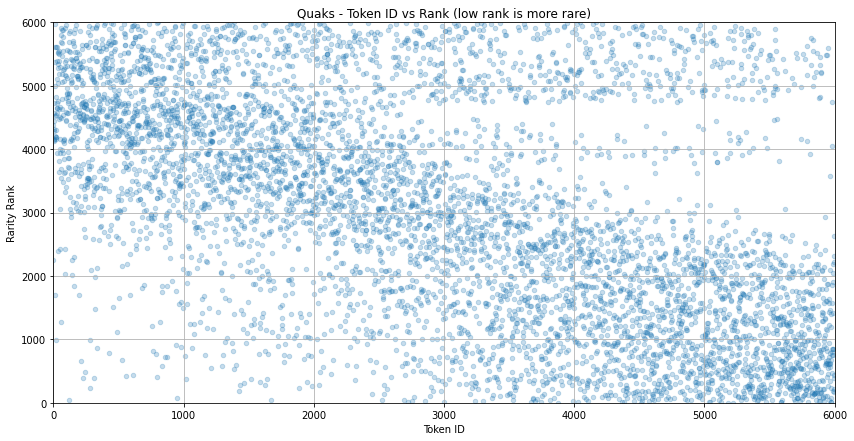
ax = RARITY_DB.plot.scatter(
x="TOKEN_ID",
y="Rank",
grid=True,
alpha=0.25,
title="{} - Token ID vs Rank (low rank is more rare)".format(FILE),
figsize=(14, 7),
)
ax.set_xlabel("Token ID")
ax.set_ylabel("Rarity Rank")
plt.xlim(lower_bound, upper_bound)
plt.ylim(0, top_n)