"""
Generate Plot
"""
if LAST_N_EVENTS <= constants.OPENSEA_MAX_LIMIT:
events = get_opensea_data(CONTRACT, continuous=False)
else:
events = get_opensea_data(CONTRACT, continuous=True)
events = events[:LAST_N_EVENTS]
for event in events:
try:
token_id = int(event["asset"]["token_id"])
sale = dict()
sale["TOKEN_ID"] = token_id
sale["USER"] = event["transaction"]["from_account"]["address"]
sale["SELLER"] = event["seller"]["address"]
sale["DATE"] = event["created_date"]
sale["RANK"] = int(RARITY_DB[RARITY_DB["TOKEN_ID"] == token_id]["Rank"])
sale["PRICE"] = float(event["total_price"]) / constants.ETHER_UNITS # type: ignore
except:
continue
sales.append(sale)
df = pd.DataFrame(sales)
df = df[df["RANK"].notna()]
df.to_csv(f"{config.ROOT_DATA_FOLDER}/recent_sales.csv")
X = df["RANK"].values.reshape(-1, 1)
Y = df["PRICE"].values.reshape(-1, 1)
linear_regressor = LinearRegression()
linear_regressor.fit(X, Y)
Y_pred = linear_regressor.predict(X)
df = df.sort_values(by="RANK")
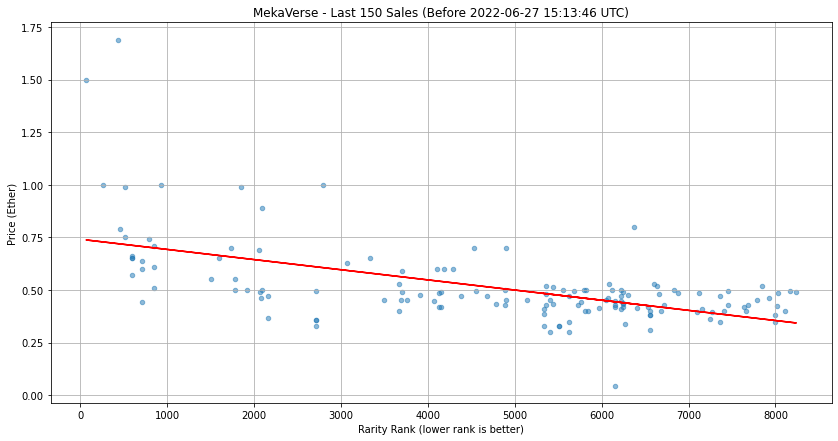
ax = df.plot.scatter(
x="RANK",
y="PRICE",
grid=True,
alpha=0.5,
title=COLLECTION_NAME,
figsize=(14, 7),
)
if GRIFTER_ADDRESS != "":
GRIFTER_DB = df[df["SELLER"] == GRIFTER_ADDRESS]
ranks = GRIFTER_DB["RANK"]
prices = GRIFTER_DB["PRICE"]
plt.scatter(x=ranks, y=prices, color="black", s=25)
plt.plot(X, Y_pred, color="red")
plt.xlabel("Rarity Rank (lower rank is better)")
plt.ylabel("Price (Ether)")
plt.title(
f"{COLLECTION_NAME} - Last {LAST_N_EVENTS} Sales (Before {datetime.datetime.now(datetime.timezone.utc).strftime('%Y-%m-%d %H:%M:%S %Z')})"
)
plt.savefig(f"{config.FIGURES_FOLDER}/{COLLECTION_NAME}_price_vs_rank.png")
plt.show()