"""
@author: mdigi14
Adapted from 'rarity_map.ipynb'
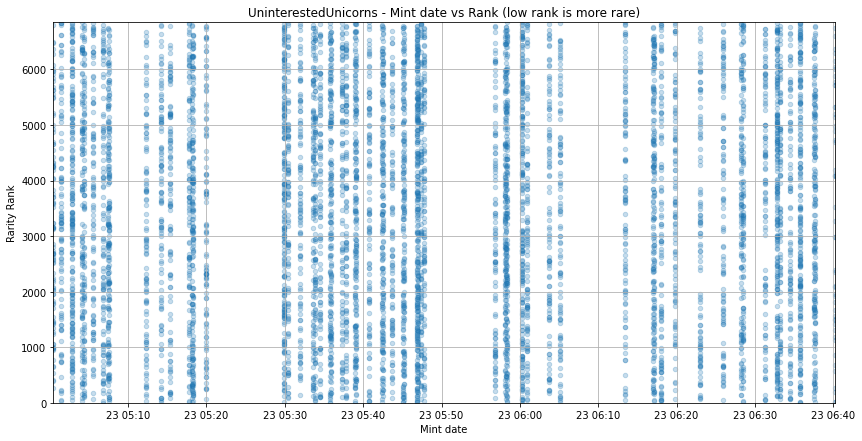
Shows graph of Token Mint Date vs Token Rarity
"""
import pandas as pd
import matplotlib.pyplot as plt
import datetime as dt
from honestnft_utils import config
PATH = f"{config.MINTING_FOLDER}/{FILE}_minting.csv"
RARITY_DB = pd.read_csv(PATH)
RARITY_DB = RARITY_DB[RARITY_DB["TOKEN_ID"].duplicated() == False]
override = False
if override:
START_DATE = "2021-08-31T15:10:00"
END_DATE = "2021-09-01T06:10:00"
TOP_N = 10000
else:
TOP_N = max(RARITY_DB["TOKEN_ID"])
"""
Plot params
"""
plt.rcParams.update({"figure.facecolor": "white", "savefig.facecolor": "white"})
"""
Helper Functions
"""
def print_graph(RARITY_DB: pd.DataFrame) -> None:
if TOKEN_COL == "TOKEN_NAME":
RARITY_DB["TOKEN_ID"] = (
RARITY_DB["TOKEN_NAME"].str.split("#").str[1].astype(int)
)
# make sure this is a string
RARITY_DB["time"] = RARITY_DB["time"].astype(str)
RARITY_DB["time"] = pd.to_datetime(RARITY_DB["time"], format="%Y-%m-%dT%H:%M:%S")
# define x-axis limits
if override:
LOWER_BOUND = dt.datetime.strptime(START_DATE, "%Y-%m-%dT%H:%M:%S")
UPPER_BOUND = dt.datetime.strptime(END_DATE, "%Y-%m-%dT%H:%M:%S")
else:
LOWER_BOUND = min(RARITY_DB["time"])
UPPER_BOUND = max(RARITY_DB["time"])
ax = RARITY_DB.plot.scatter(
x="time",
y="rank",
grid=True,
alpha=0.25,
title="{} - Mint date vs Rank (low rank is more rare)".format(FILE),
figsize=(14, 7),
)
ax.set_xlabel("Mint date")
ax.set_ylabel("Rarity Rank")
plt.xlim(LOWER_BOUND, UPPER_BOUND)
plt.ylim(0, TOP_N)
print_graph(RARITY_DB)